Bars & Areas (dataviz)
For implementation, see Tokens & CSS > Background or Border.
Bars and columns
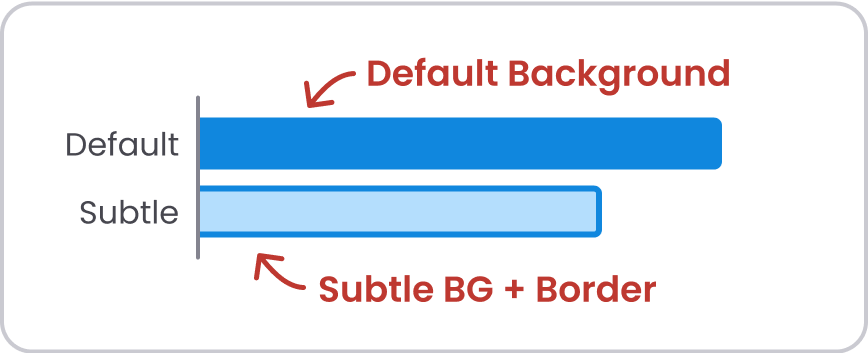
When you are encoding data in bars and columns, you have two options:
- Default Background. Example:
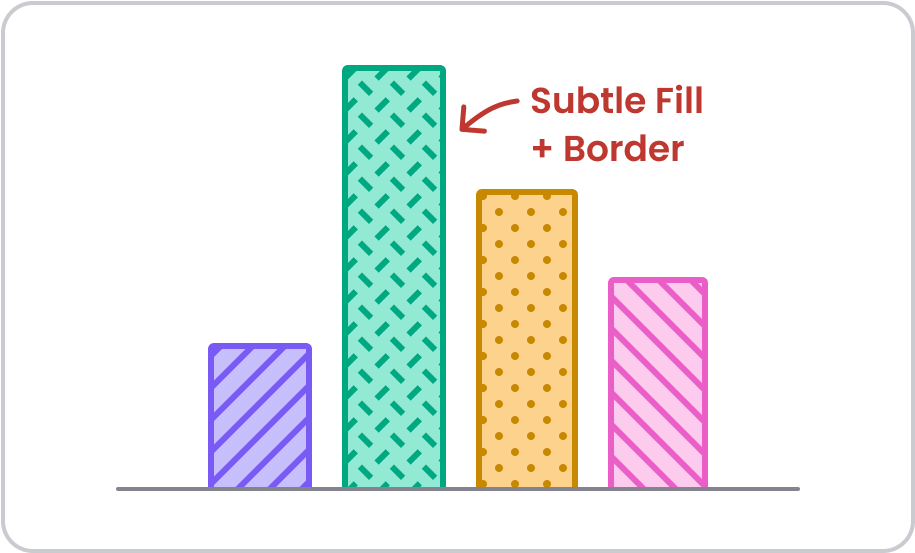
background-primary - Subtle Background. Example:
background-primary-subtleandborder-primary
The subtle variant can be used alone or together with the default color to indicate something of less importance. The subtle colors need a 3 px border around the bar to achieve good enough contrast against the background.
You may also add a pattern inside the area when using the subtle background, see Patterns in bars and areas.
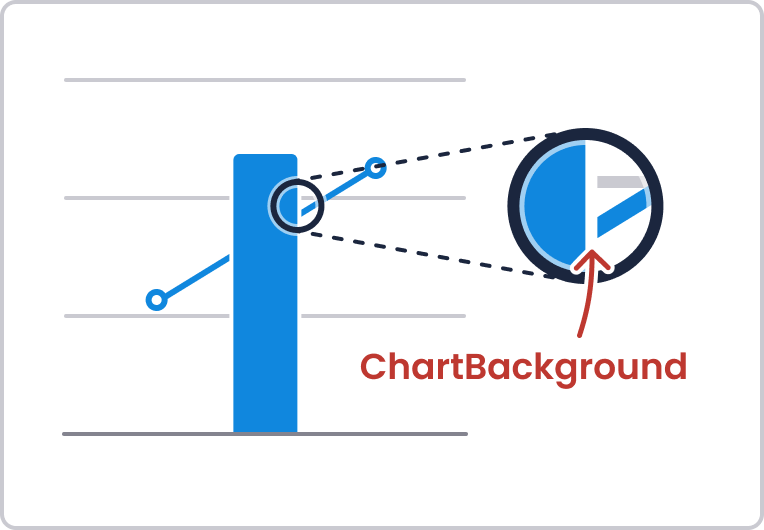
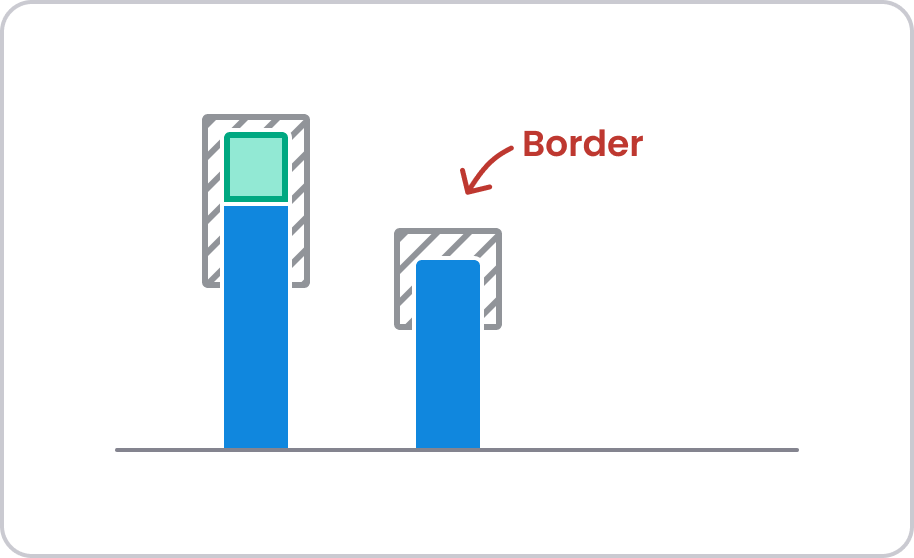
Optional: ChartBackground around bar
When bars are placed on top of gridlines and other data elements, it becomes harder to differentiate the bar from the elements below.
Consider adding a border (or slightly larger bar behind the data bar) with the ChartBackground/Default color. As a result, a small gap appears between the elements, making it easier to differentiate between them.
In Figma, this is implemented in the bar components.
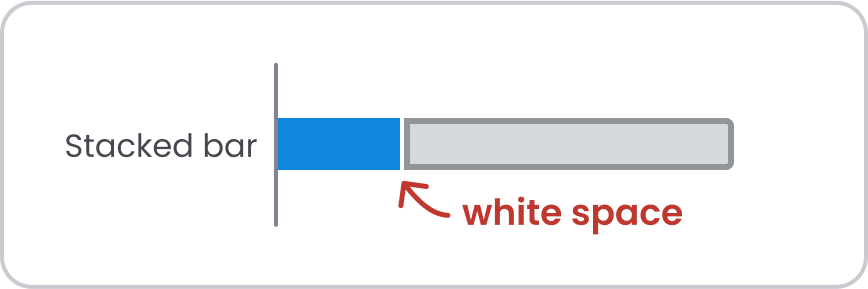
Stacked bars and columns
Pro tip 💡
If you are creating stacked bar charts, add white space between each color to make it easier to identify each part.
If you add white space between each bar segment, and there are several stacked bars next to each, the white space should not affect the total hight/width of the stacked bars. Instead, remove the same amount of height/width from each bar segment (for example one pixel per bar segment). In this way, the total height/width of each stacked bar can be compared with one another.
In Figma, this is implemented in the stacked bar components.
Areas
For areas, such as area charts, there are a few options for color usage.
1. Default background
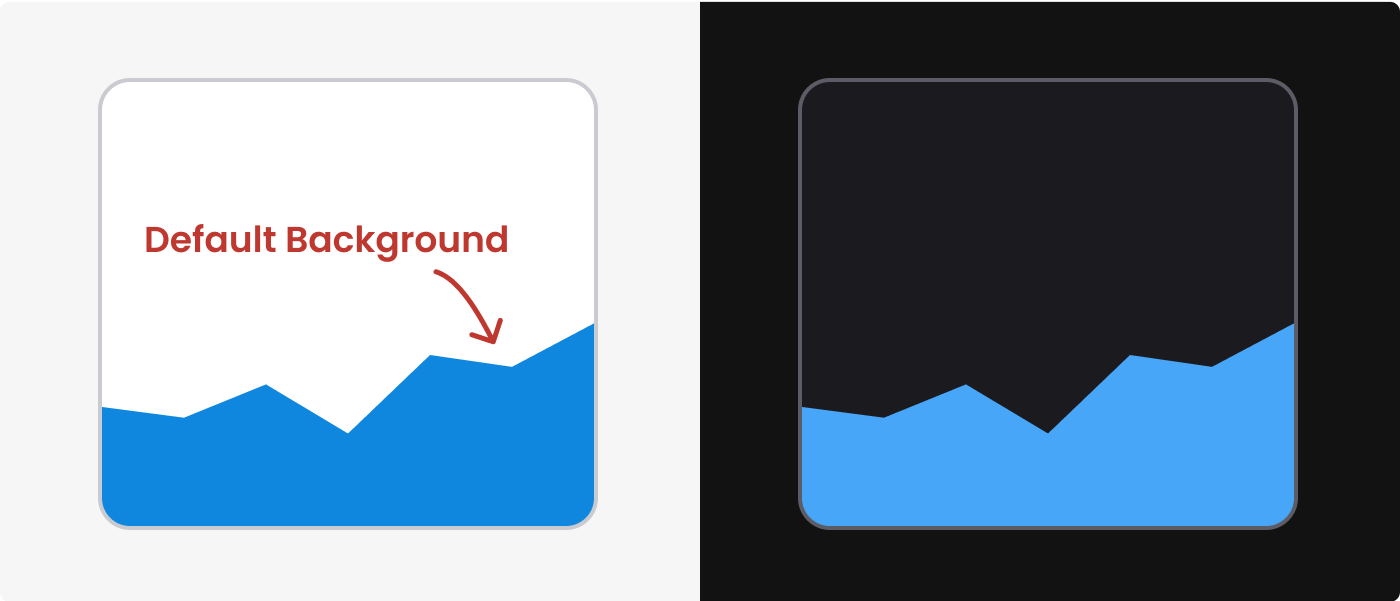
Use the default color, for example background-primary.
If you are creating stacked area charts, consider adding white space between each color to make it easier to identify each area.
2. Subtle background with border
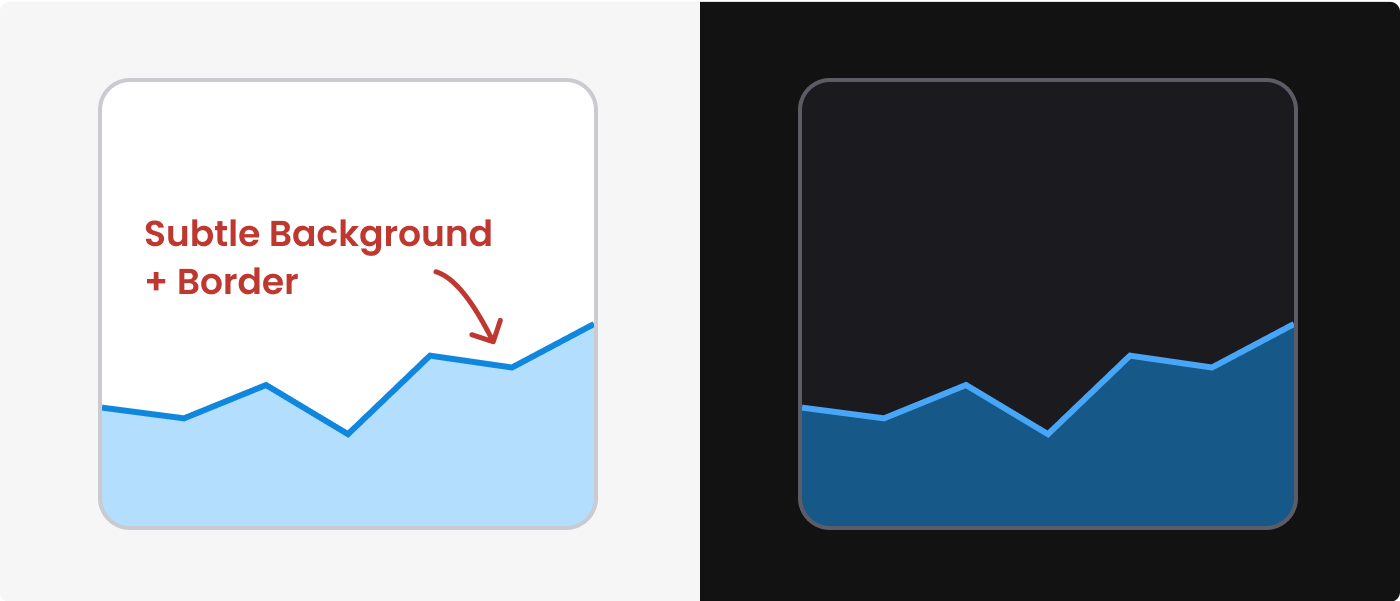
Large areas of the default Background color might become too intense. In that case, consider using the subtle background color combined with border. Example: background-primary-subtle and border-primary.
The border is only necessary on the part of the area that shows the values (typically the top, as in the example above).
You may also add a pattern inside the area, see Patterns in bars and areas.
3. Gradient with border
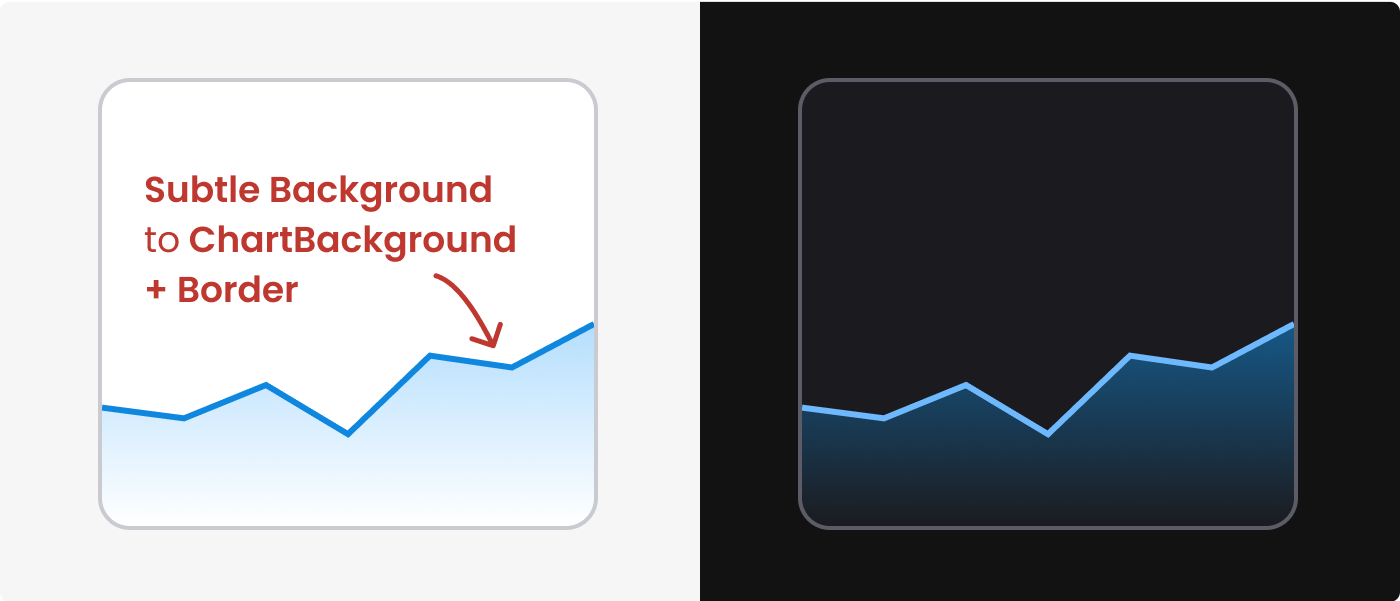
To make the area less prominent, consider using a gradient fill. Technically, this can be solved in different ways:
- Make a gradient between the subtle background color and the chart background color. Example:
background-primary-subtletochartbackground. - Use opacity, and make the gradient between the same subtle background color with 100 % and 0 % opacity.
Include a border, similar to using a subtle background.
Patterns in bars and areas
Patterns can make it easier to distinguish between categories, benefiting people with color deficiencies as well as those printing in gray scale.
In Figma, there is an option to apply patterns to bars. However, different dataviz libraries might have specific options for patterns, so it might be useful to consider the technical possibilities before choosing a pattern.
For patterns in bars or areas, use Background Subtle (or no fill) combined with Border colors. As a result, the border of the bar/area will have the same color as the pattern inside.
There is no particular mapping between dataviz colors and patterns, but be consistent if you apply patterns across graphs.
Note that extensive use of patterns can make the graph appear busy and chaotic, and thereby less accessible for many users.
Other methods you can use to distinguish between categories, reducing the need for patterns:
- Text labels: connect text labels to categories for easy identification
- Shapes or positions: Use different shapes or positions for different data categories
- Fill and border: combine solid fill for one category with subtle fill and border for another category
- Small multiples: split data into several small graphs to avoid relying on color coding
- Filters: implement filters and popover information for interactive data exploration
- Hover and focus states: show patterns on hover or with keyboard focus.
Prediction area
For prediction area, use the gray Secondary border color (border-secondary) with diagonal lines. For the background, use chartbackground, or no color at all.
Color tokens
Background (dataviz)
| Name | Light/Dark mode | Description |
|---|---|---|
ChartBackground/Default |  | White/Black background |
Background/Primary |  | Blue – if you only need one color |
Background/Secondary |  | Gray – for a secondary color |
Background/Category1 |  | Indigo - representing category 1 |
Background/Category2 |  | Yellow - representing category 2 |
Background/Category3 |  | Pink - representing category 3 |
Background/Category4 |  | Green - representing category 4 |
Background/Category5 |  | Orange - representing category 5 |
Background/Category6 |  | Teal - representing category 6 |
Background/Category7 |  | Blue - representing category 7 |
Background/Category8 |  | Gray - representing category 8 |
Background/Positive |  | Gray - representing something positive |
Background/Warning |  | Warning - representing something worrisome |
Background/Negative | | Red - representing something negative |
Background/Neutral | | Gray - representing something neutral |
Background-Subtle (dataviz)
Needs a border to have enough contrast against the background.
| Name | Light/Dark mode | Description |
|---|---|---|
Background/Primary-Subtle |  | Blue – if you only need one color |
Background/Secondary-Subtle |  | Gray – for a secondary color |
Background/Category1-Subtle |  | Indigo - representing category 1 |
Background/Category2-Subtle |  | Yellow - representing category 2 |
Background/Category3-Subtle |  | Pink - representing category 3 |
Background/Category4-Subtle |  | Green - representing category 4 |
Background/Category5-Subtle |  | Orange - representing category 5 |
Background/Category6-Subtle |  | Teal - representing category 6 |
Background/Category7-Subtle |  | Blue - representing category 7 |
Background/Category8-Subtle |  | Gray - representing category 8 |
Background/Positive-Subtle |  | Gray - representing something positive |
Background/Warning-Subtle |  | Warning - representing something worrisome |
Background/Negative-Subtle | | Red - representing something negative |
Background/Neutral-Subtle | | Gray - representing something neutral |
Border (dataviz)
Border around Background Subtle.
| Name | Light/Dark mode | Description |
|---|---|---|
Border/Primary |  | Blue – border around Background/Primary-Subtle |
Border/Secondary |  | Gray border around Background/Secondary-Subtle |
Border/Category1 |  | Indigo - border around Background/Category1-Subtle |
Border/Category2 |  | Yellow - border around Background/Category2-Subtle |
Border/Category3 |  | Pink - border around Background/Category3-Subtle |
Border/Category4 |  | Green - border around Background/Category4-Subtle |
Border/Category5 |  | Orange - border around Background/Category5-Subtle |
Border/Category6 |  | Teal - border around Background/Category6-Subtle |
Border/Category7 |  | Blue - border around Background/Category7-Subtle |
Border/Category8 |  | Gray - border around Background/Category8-Subtle |
Border/Positive |  | Gray - border around Background/Positive-Subtle |
Border/Warning |  | Warning - border around Background/Warning-Subtle |
Border/Negative | | Red - border around Background/Negative-Subtle |
Border/Neutral | | Gray - border around Background/Neutral-Subtle |