Color Guidelines for Design (dataviz)
For implementation, see Tokens & CSS.
Color plays an important role in data visualization, and can be used to encode data in many ways. In addition, color is often the first thing we perceive on a screen and can be used to guide the user's attention.
On this page:
Chart colors vs data colors
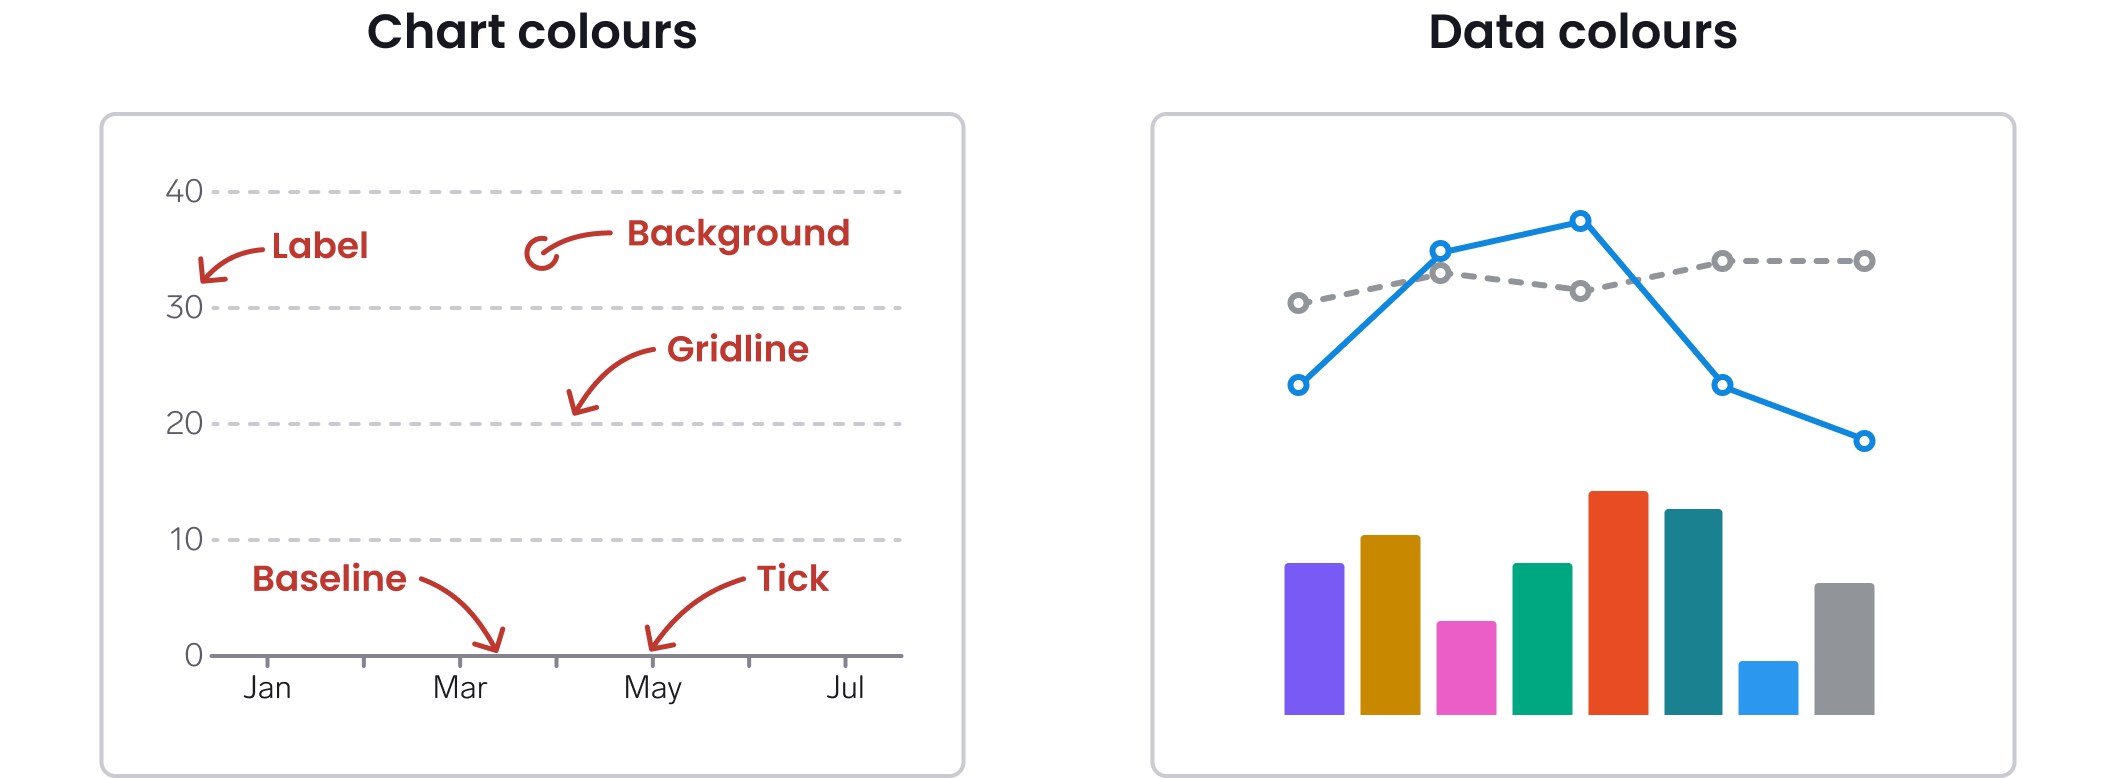
There are two main categories of dataviz colors:
- We use Chart colors for non-data elements in the chart, such as gridlines, axes and text labels
- We use Data colors are for visual elements that encode data, such as lines, bars and areas.
The dataviz colors are the same across all Vend brands.
Semantic tokens
The dataviz library is structured in a similar way as the regular WARP UI library, using semantic tokens. Semantic tokens are variables that refer to another color, but can be changed dynamically, for example when switching between light mode and dark mode.
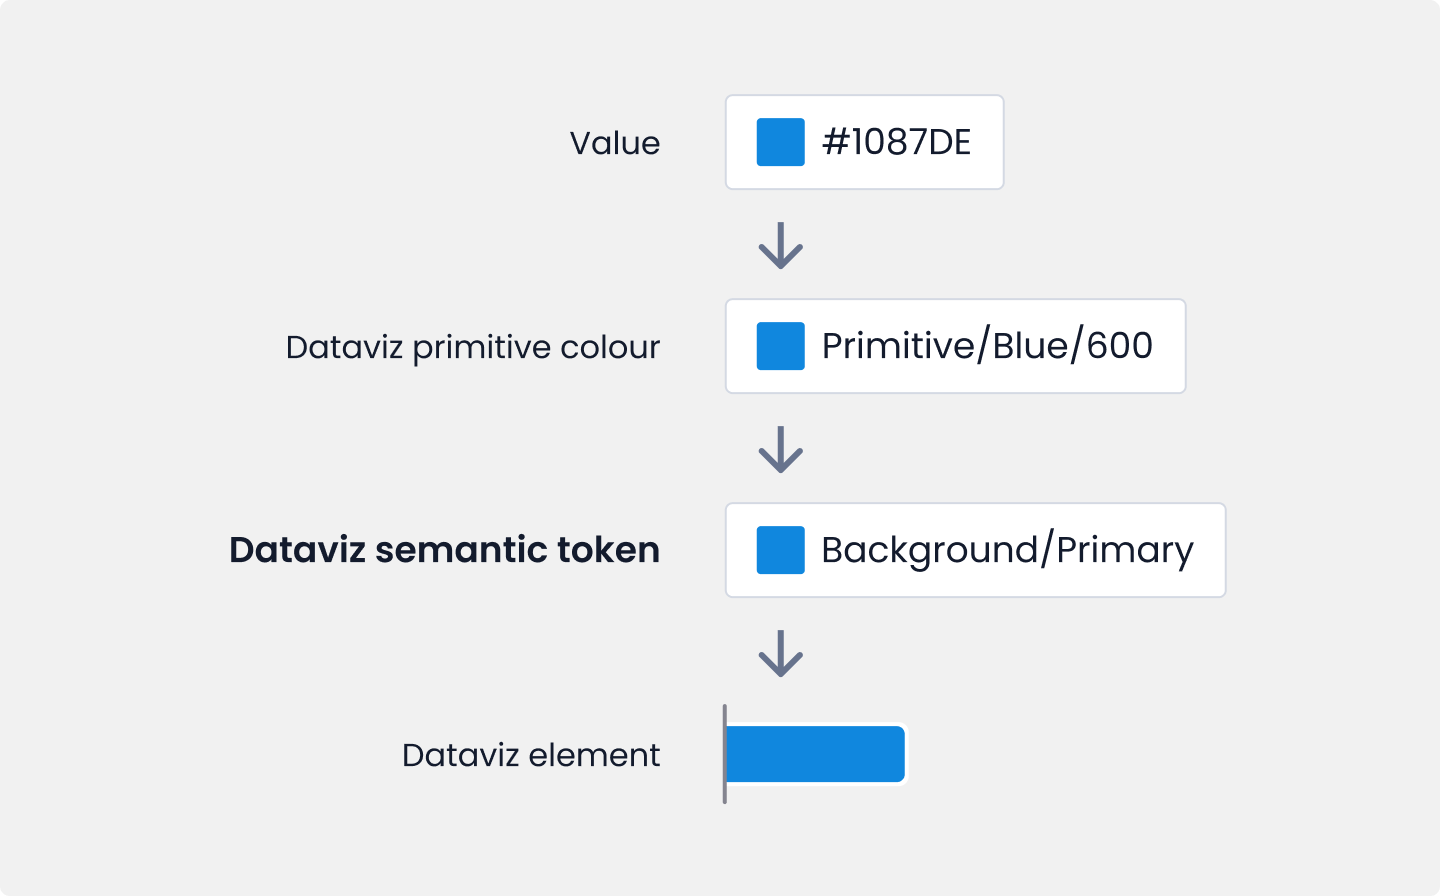
Color values are stored in color primitives, which are connected to semantic tokens, which are applied to dataviz elements.
Semantic tokens allow us to use colors in a consistent and meaningful way, makes it easy to swap between light mode and dark mode. In addition, if we want to adjust a color, we only have to change one value and it will be applied everywhere the token is used.
Token categories
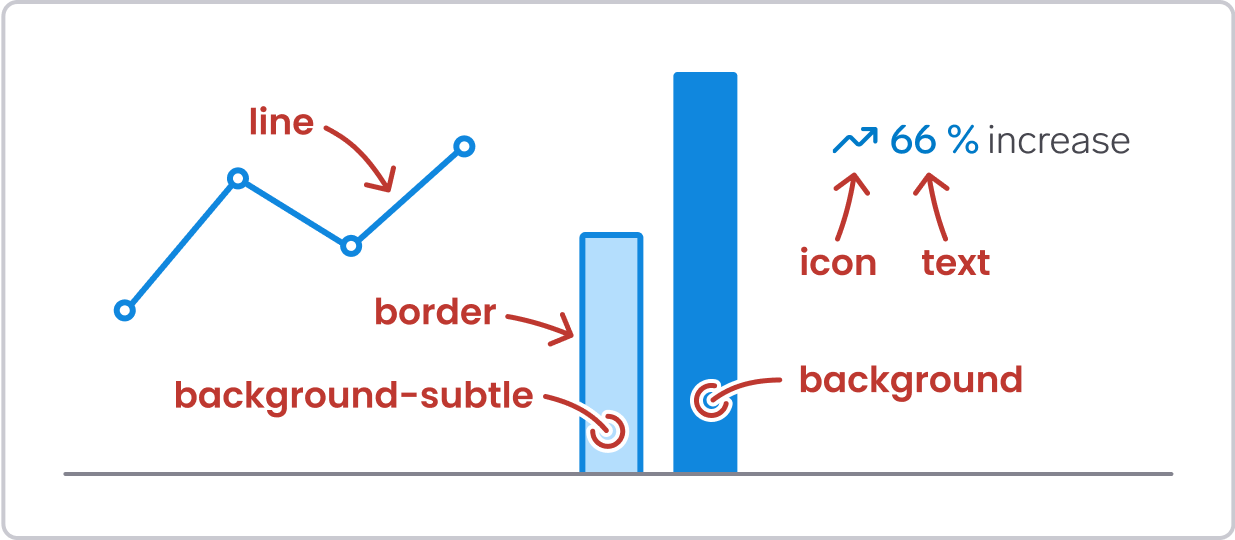
Data visualizations can be made using a variety of shapes, and it is not necessary nor useful to define colors for all those shapes. We have defined 5 semantic token categories that should cater for most use cases: line, background, border, text and icon.
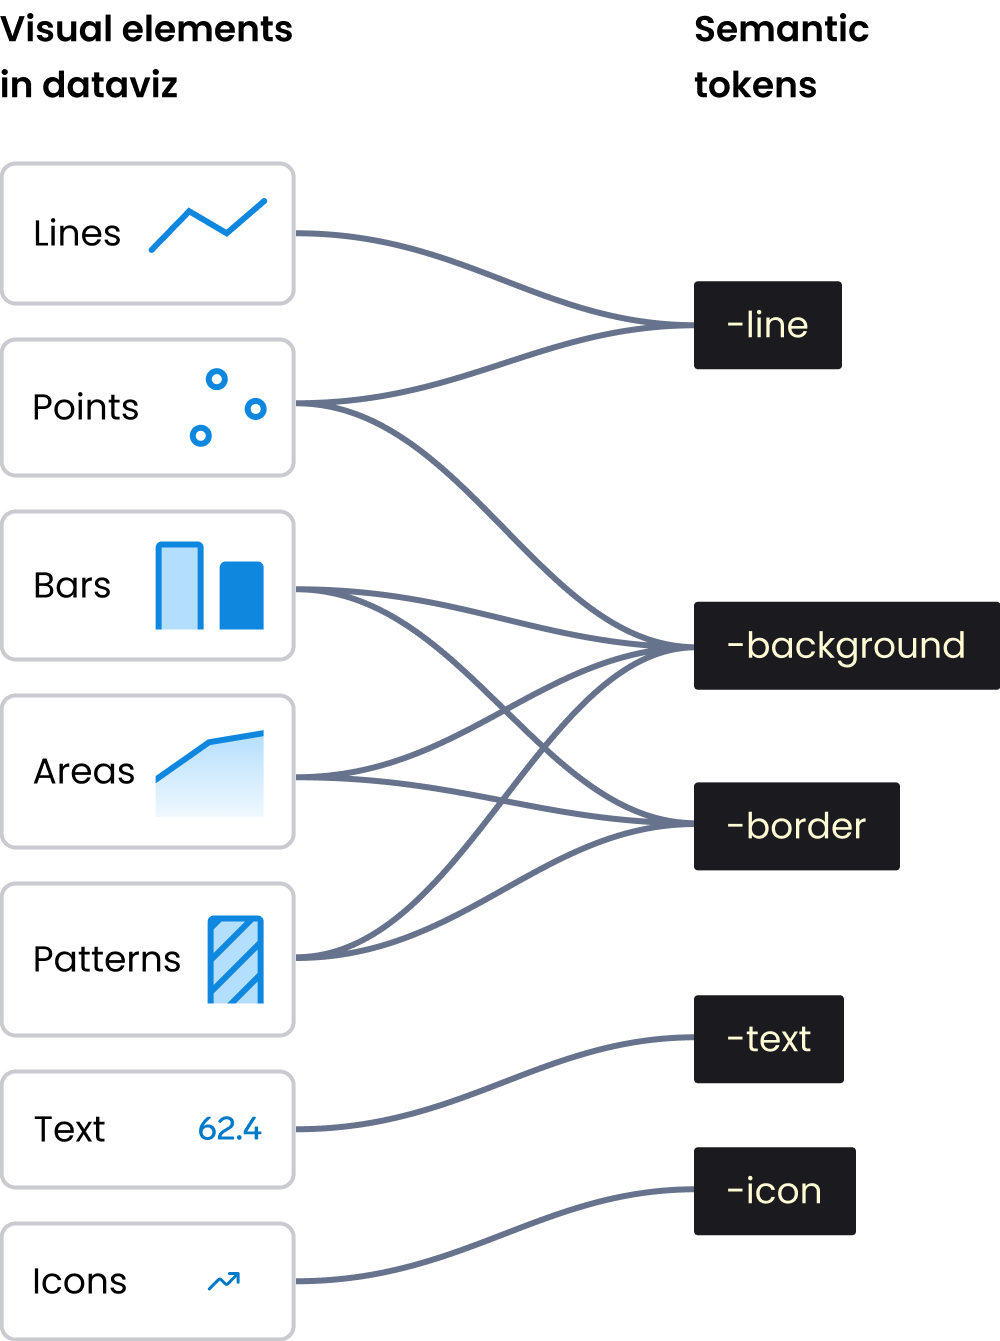
Mapping dataviz elements to semantic tokens
Some visual elements need to use more than one color token. For example, a bar with a subtle background color needs both a background color and a border color.
In the following pages you can read more about the two main categories of dataviz colors:
Then, you can read more about which semantic tokens to use for data colors:
- Lines & Points
- Bars & Areas (and Patterns)
- Text & icons
FAQ
Why should we use these colors? 🧐
When we use the dataviz colors, we get:
- Automagic theming for dark mode and light mode
- Colors that are suitable for data visualization (which UI colors most often are not)
- Colors that are accessible, both in terms of contrast, and for the most common color deficiency (deuteranomaly, which affects 1 in 12 men)
- A consistent and great dataviz experience across our services.
Why do we use the same colors across all brands? 🙄
The value of having different colors for each brand would be quite low, while the cost of creating, implementing and maintaining accessible colors across multiple brands would be very high. That said, it is possible to override some or all colors for specific brands in the future if there is a good reason for doing so. But creating a new and accessible color palette is not a trivial task.
Why did you choose blue for the Primary color? 💦
The most important reasons for choosing blue as a primary color:
- Blue is already central to most of our brands, and most brands use blue in the UI. Therefore we ensure a level of visual harmony between UI and visualizations
- Blue is not directly associated with positive or negative (in contrast to red and green, for example), and is therefore a good starting point for a color palette.
- By using the same primary color across multiple graphs, the page will get a harmonic look and feel.
Can I use the brand color or UI colors for graphs? ⛔️
Do not use brand colors or UI colors from WARP in regular graphs in our products. Those colors are reserved for other use cases.
The only exception we envision is to use the Primary UI color if a graph is integrated in an interactive component, such as a slider.
Why are there sooo many colors? 🤯
Yes, we know it’s a lot. Here are some reasons why we need so many dataviz colors:
- Different colors for different visual elements such as lines and areas due to accessibility and readability. Thin lines need higher contrast than large areas. As a result, we use different colors shades for different visual elements. We also needed to adjust the colors per visual element type so that they work well together; for example, line colors are adjusted to make sure they are possible to differentiate when used next to each other.
- Define colors based on semantic use, not the color itself. This allows us to change things in a meaningful way later. For example, a gray color is used both for the
Secondary,Category8andNeutralcolors. If we later decide that we should use some other color for Category8, for example, we can change that specific color without changing the Secondary and Neutral color. - Allow for some flexibility, so that product teams have some options to choose from based on their specific needs
Why are the colors so light or dark? 🧑🏻🎨
The lightness of the colors are based on accessibility requirements.
For measuring contrast for each individual color, we have used both WCAG 2 (3:1 for visual elements) the Accessible Perceptual Contrast Algorithm (APCA). APCA more accurately accounts for how perception works than WCAG 2. In addition, it takes the size and width of elements into account. This is particularly noticeable in dark mode, where APCA requires higher contrast.
In addition, we have adjusted lightness in order to make the colors work well together in the different palettes. For example, the lightness of the categorical colors vary so that they are easier to differentiate for people with color deficiencies.
Why use dataviz chart colors and not regular WARP colors?
Some of the chart colors are identical to regular WARP colors, for example the background and the text colors. However, there are a few reasons why we provide these colors in the dataviz library:
- In Figma, it is convenient for designers to have all the colors they need for charts in one library
- In code, the dataviz colors can be applied to SVG elements using utility classes
- Some components (in Figma) need the
ChartBackgroundcolor as part of the component - Users of the dataviz library get all the colors they need for creating charts, and the library can therefore be used independent of WARP
- The
ChartBackgroundcolor ensures good contrast between the dataviz elements and the background, which might not be the case if using other WARP background colors - At the time of writing (January 2025) there is no distinction between border and border subtle in WARP, which is needed for gridlines.
However, it is of course possible for a developer to use other colors for chart elements if there is a good reason to do so.