Lines & Points (dataviz)
For implementation, see Tokens & CSS > Line.
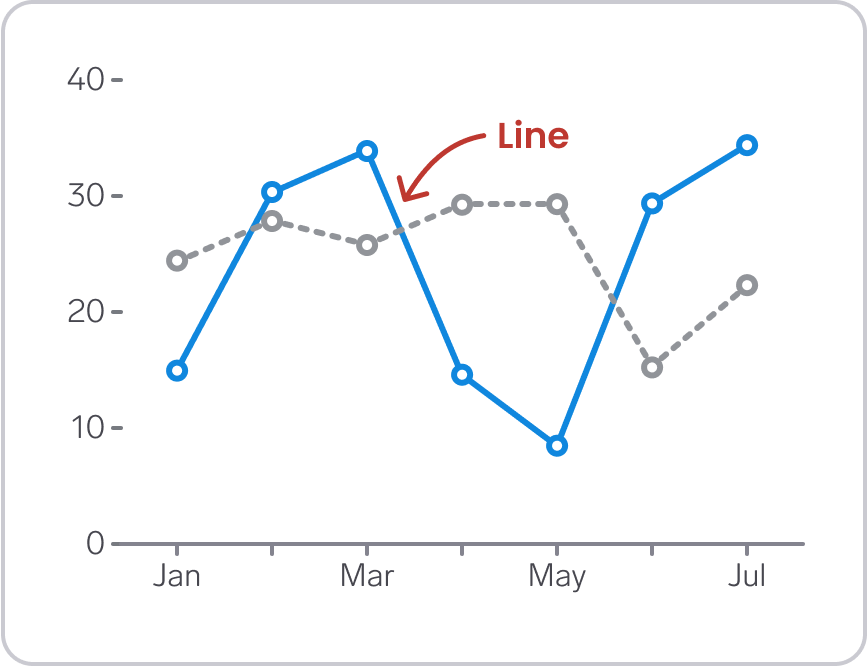
Lines
- Use the
Linecolors for lines. - Lines should have a width of minimum 3 px to ensure sufficient contrast against the background
- Straight lines are usually better than smooth curves, as curves can be misinterpreted as representing data values or trends that are not present in the data
- Consider adding dashed stroke for lines when you include lines of different colors. Dashed lines appear less important than solid lines, and are therefore well suited for secondary information
- Adding points along lines can help users understand where the actual data points are placed, and that the line is simply a interpolation between points.
Points
- Use the
Linecolors for points. Points are often combined with lines in a chart, and therefore we use the same color for lines and points - To use the Line color on points in Figma, the points need to have a stroke (like a donut 🍩). If you don’t want a donut with space in the middle, make the stroke thicker
- Points (or lines around points) should have a width of minimum 3 px to ensure sufficient contrast against the background.
'Donut' points
If you go for the donut variant of points, use either ChartBackground/Default or a Background Subtle as the fill color.
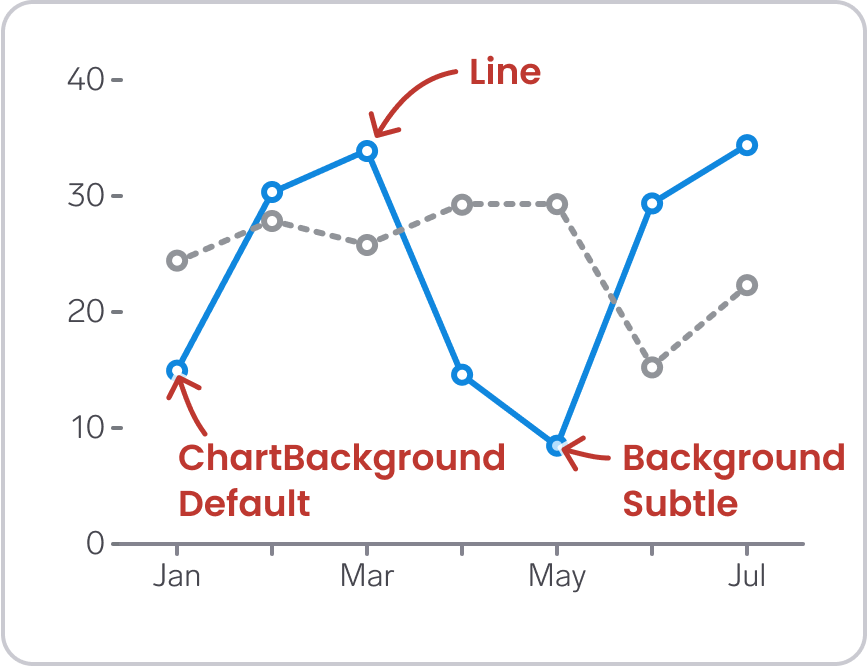
An advantage of using Background Subtle is that it becomes logical to use Background Subtle-Highlight when interacting with the points.
Line dashes and point shapes
Line dashes can make it easier to distinguish between categories, benefiting people with color deficiencies as well as those printing in gray scale. For example, it makes sense to use a solid stroke style for the primary line using the Primary color, and dashes for the secondary line using the secondary color.
For points, consider using different point shapes for each category. However, using many different point shapes can make the graph appear disorienting and chaotic, and thereby work against its intended purpose. One acceptable solution is to show point shapes on interaction, like hover and focus. Different dataviz libraries might have specific options for point shapes, so it might be useful to consider the technical possibilities before choosing shapes.
Color tokens
Line colors (dataviz)
Stroke color for lines and points.
| Name | Light/Dark mode | Description |
|---|---|---|
Line/Primary |  | Blue – if you only need one line |
Line/Secondary |  | Gray – for a secondary line |
Line/Category1 |  | Indigo - lines representing category 1 |
Line/Category2 |  | Yellow - lines representing category 2 |
Line/Category3 |  | Pink - lines representing category 3 |
Line/Category4 |  | Green - lines representing category 4 |
Line/Category5 |  | Orange - lines representing category 5 |
Line/Category6 |  | Teal - lines representing category 6 |
Line/Category7 |  | Blue - lines representing category 7 |
Line/Category8 |  | Gray - lines representing category 8 |
Line/Positive |  | Gray - lines representing something positive |
Line/Warning |  | Warning - lines representing something worrisome |
Line/Negative | | Red - lines representing something negative |
Line/Neutral | | Gray - lines representing something neutral |
Background colors (dataviz)
For use inside 'donut' points.
| Name | Light/Dark mode | Description |
|---|---|---|
ChartBackground/Default |  | White/Black background |
Background/Primary-Subtle |  | Blue – if you only need one color |
Background/Secondary-Subtle |  | Gray – for a secondary color |
Background/Category1-Subtle |  | Indigo - representing category 1 |
Background/Category2-Subtle |  | Yellow - representing category 2 |
Background/Category3-Subtle |  | Pink - representing category 3 |
Background/Category4-Subtle |  | Green - representing category 4 |
Background/Category5-Subtle |  | Orange - representing category 5 |
Background/Category6-Subtle |  | Teal - representing category 6 |
Background/Category7-Subtle |  | Blue - representing category 7 |
Background/Category8-Subtle |  | Gray - representing category 8 |
Background/Positive-Subtle |  | Gray - representing something positive |
Background/Warning-Subtle |  | Warning - representing something worrisome |
Background/Negative-Subtle | | Red - representing something negative |
Background/Neutral-Subtle | | Gray - representing something neutral |