Text & Icons (dataviz)
For implementation, see Tokens & CSS > Text or Icon.
Text
In general, use ChartText (black/gray/white) color for numbers and labels.
However, the Text data colors can be relevant to use in two situations:
- Text labels. Color can be used on labels, matching the color of the visual data element (such as a line or a bar)
- Data values. Color can be used on data values.
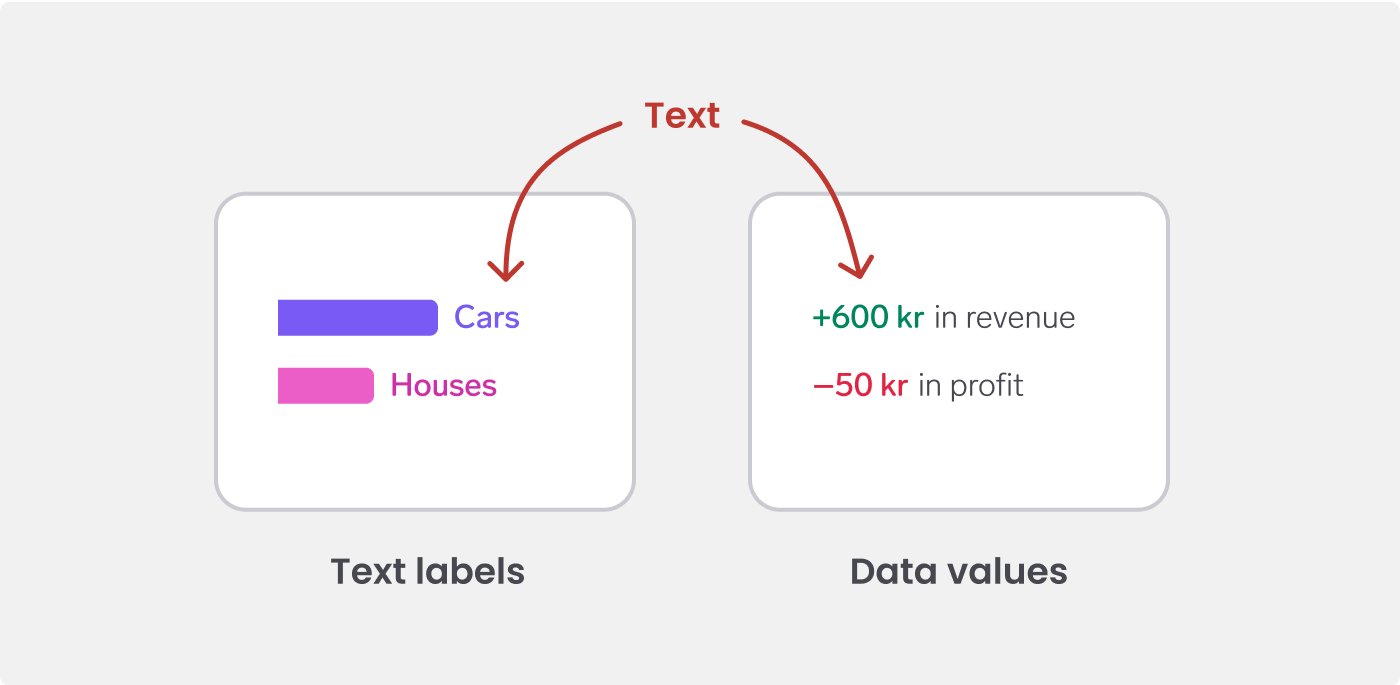
Only use color on text if it makes it easier to visually connect the text to the data marks, or interpret values. Otherwise, use the default text color. See Chart colors.
Use Body Strong font style or larger with Text to ensure good contrast.
Icons
In general, use WARP colors on icons in the interface.
However, the dataviz icon colors can be relevant in two situations:
- Indicate trend. Place an icon next to a value to help users understand if the value is trending up or down. Use Evaluation colors to reinforce the message of the icon.
- Label values. Use an icon to label the data, possibly in combination with text labels. Using the same color on the icon and the text can help users visually connect the label to the data.
Only use color on icons if it makes it easier to visually connect the text to the data marks, or interpret values. Otherwise, use the default icon color.
The icon colors are the same as the text colors, to make them work well together and have good contrast against the background.
![]()
Color tokens
Text color tokens (dataviz)
| Name | Light/Dark mode | Description |
|---|---|---|
Text/Primary |  | Blue – if you only need one color |
Text/Secondary |  | Gray – for a secondary color |
Text/Category1 |  | Indigo - representing category 1 |
Text/Category2 |  | Yellow - representing category 2 |
Text/Category3 |  | Pink - representing category 3 |
Text/Category4 |  | Green - representing category 4 |
Text/Category5 |  | Orange - representing category 5 |
Text/Category6 |  | Teal - representing category 6 |
Text/Category7 |  | Blue - representing category 7 |
Text/Category8 |  | Gray - representing category 8 |
Text/Positive |  | Gray - representing something positive |
Text/Warning |  | Warning - representing something worrisome |
Text/Negative | | Red - representing something negative |
Text/Neutral | | Gray - representing something neutral |
Icon color tokens (dataviz)
| Name | Light/Dark mode | Description |
|---|---|---|
Icon/Primary | Blue – if you only need one color | |
Icon/Secondary | Gray – for a secondary color | |
Icon/Category1 | Indigo - representing category 1 | |
Icon/Category2 | Yellow - representing category 2 | |
Icon/Category3 | Pink - representing category 3 | |
Icon/Category4 | Green - representing category 4 | |
Icon/Category5 | Orange - representing category 5 | |
Icon/Category6 | Teal - representing category 6 | |
Icon/Category7 | Blue - representing category 7 | |
Icon/Category8 | Gray - representing category 8 | |
Icon/Positive | Gray - representing something positive | |
Icon/Warning | Warning - representing something worrisome | |
Icon/Negative | Red - representing something negative | |
Icon/Neutral | Gray - representing something neutral |